- Home
- Computer Technology
- Virtual Worlds
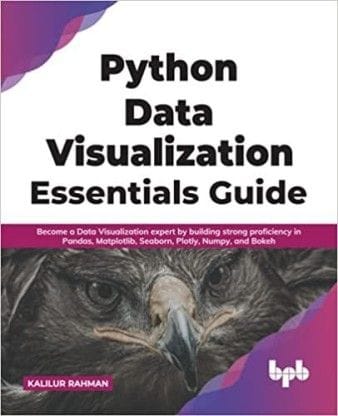
- Python Data Visualization Essentials Guide
Python Data Visualization Essentials Guide
Author: Kalilur Rahman
Brand: BPB Publications
| VARIANT | SELLER | PRICE | QUANTITY |
|---|
Description of product
Renting Guidelines
Specification of Products
| Brand | BPB Publications |
Related products
User reviews
1 Review
Engaging and informative guide on Python data visualization. Clear explanations and useful examples make it a must-read for beginners.Jul 31, 2023 3:06:49 PM
INFORMATION
ADDRESS
Trubrain Education India Pvt Ltd"VV Square"building, Plot.No.TS 710/1b1 & 2B1, CMC Ward No 18, Moka road, Gandhinagar, Ballari-583 101.
Bellari
Karnataka - 583101
IN
Welcome to our online bookstore, the ultimate destination for book lovers, stationery enthusiasts, and curious minds of all ages. With our extensive selection of books, including bestsellers, new releases, and used books, as well as a range of stationary, toys, and reading accessories, we have everything you need to ignite your imagination and satisfy your curiosity.
Whether you're looking for an exciting sci-fi novel, an inspiring biography, or a fun activity book for your kids, our online bookstore has it all. We offer a wide variety of genres, including fiction, non-fiction, children's books, and educational books, so you're sure to find something that sparks your interest.
In addition to traditional books, we also offer e-books for those who prefer to read on their electronic devices. And if you're looking for a more sustainable option, our used books section offers pre-owned books in great condition, helping to reduce waste and save money.
To complement our extensive book selection, we also offer a range of high-quality stationery, including art supplies, pens and pencils, notebooks, and journals. Whether you're an aspiring artist, a student, or a professional, we have everything you need to unleash your creativity and get organized.
And for those who prefer to rent rather than purchase, our book rental service allows you to enjoy your favorite books for a limited time at an affordable price.
At our online bookstore, we're committed to providing our customers with the best possible shopping experience. Our user-friendly website makes it easy to find and purchase your favorite books and stationery items, and our fast and reliable shipping ensures that your products are delivered to your doorstep in no time.
So whether you're a seasoned reader, a curious learner, or a parent looking for educational resources for your kids, we invite you to explore our selection and discover a world of endless possibilities. Shop with us today and experience the joy of reading and learning.

